Examples
Define uncertain values
import uncertain as uc

# Uncertain value between 3 and 8 and a normal distribution with
# mean=5 and standard deviation=1.
a = uc.UncertainValue(5, 3, 8, 'normal', [5, 1])

# Uncertain value with a uniform distribution between 0.1 and 4
b = uc.UncertainValue(1, 0.1, 4)

# Uncertain value from measured data points
c = uc.from_data([1, 2, 3, 4, 5])
Perform mathematical calculations
d = -b+2*a**(b/3)
Display properties and plot results in density plots or cumulative density plots
print(c.describe(),
"\n\nThe standard deviation of b is "+str(b.std),
"\n\nThe probability of /c/ being between 2 and 6 is " +
str(probability_in_interval(c, [2, 6])))

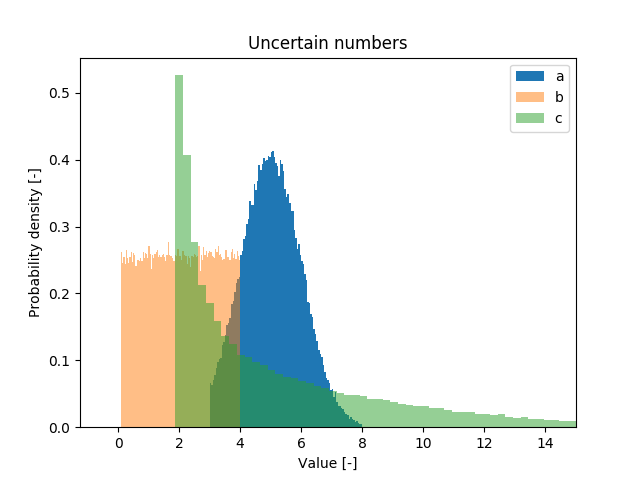
a.plot_distribution(title="Uncertain numbers", label="a")
b.plot_distribution(label="b", alpha=0.5)
d.plot_distribution(label="d", alpha=0.5)

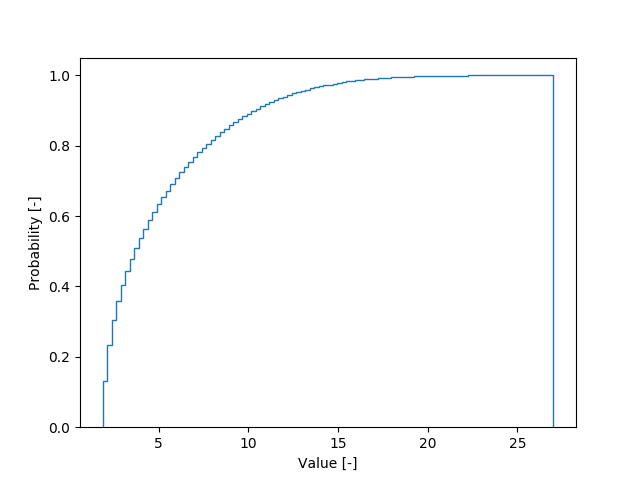
d.plot_distribution(plot_type='cdf', new_figure=True)
Output:
This variable is an uncertain value. It has the following properties:

    - Nominal value: 2.4199518933533937

    - Mean: 5.1973349566661415
    - Median: 3.8063419262133795
    - Variance: 13.086116036143682
    - Standard deviation: 3.6174737091157527
    - Skewness: 1.5519941650511524

    - Lower bound: -1.9254016053940988
    - Percentile 5: 2.0248565203431506
    - Q1: 2.432100693608657
    - Q3: 6.832833238201248
    - Percentile 95: 12.808458201483177
    - Upper bound: 31.899999999999995

    - Probability distribution type: custom
    - Number of samples: 100000


The standard deviation of b is 1.1245368594834484

The probability of /c/ being between 2 and 6 is 0.67164